|
When you first learned to graph straight lines, you did so by preparing a table (or chart) of x-values and y-values to obtain points on the graph, and you plotted these points. Since you were dealing with straight lines, with constant (never changing) slopes, only a few points (actually only two) were needed to produce the line.
A similar approach is used for graphing quadratic functions. These graphs, however, can seldom be drawn properly by plotting only two or three points because the slope of a parabola is not constant. More points are needed to uncover the shape of the graph (a parabola) and its location on the set of coordinate axes.
 Table (or chart) graphing for a quadratic function. Table (or chart) graphing for a quadratic function. |
In the section "Introduction to Quadratics", the graph of y = x2 - 4x was prepared on the specified interval of -1 < x < 5. That choice of the interval allowed the graph to show pertinent information about the function: the direction it opened, its turning point and its roots (x-intercepts).
 Graph given a specified domain (the x-values to use). Graph given a specified domain (the x-values to use).
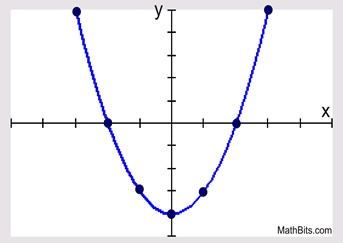
| Graph y = x2 - 4 in interval -3 < x < 3
x |
x2 - 4 |
y |
-3 |
|
5 |
-2 |
(-2)2 - 4 |
0 |
-1 |
(-1)2 - 4 |
-3 |
0 |
(0)2 - 4 |
-4 |
1 |
(1)2 - 4 |
-3 |
2 |
(2)2 - 4 |
0 |
3 |
(3)2 - 4 |
5 |
|
|
|
After plotting the points to reveal the graph, be sure to draw a "smooth" curved graph. Do not play "connect the dots" by drawing straight line segments between the points. There are no straight line segments in a parabola, as its slope is never constant. |
|
The given domain for the chart above, {-3, -2, -1, 0, 1, 2, 3}, allowed the graph to reveal
pertinent information about the function. It can be see that:
• the function is opening upward,
• the vertex (turning point, minimum point) is located at (0,-4),
• and roots (crossing the x-axis) at located at (-2,0) and (2,0), which also
tells us that the zeros of the quadratic equation x2 - 4 = 0 will be x = -2 and x = 2.
Remember that quadratic graphs are symmetric.

How do you know what x-values to use in a chart,
if the question does not give you a domain?
You might be tempted to just "guess" at the values to use for x in a chart.
And that option may work to reveal the pertinent information needed about the graph.
But, if it does not work, you will spend a good deal of time trying to figure out what
is needed to give the pertinent information.
|
Choosing Chart Values: To guarantee that the x-values you choose for your chart will show pertinent information about the graph, start by finding the axis of symmetry of the parabola from its equation. The axis of symmetry is a vertical line through the vertex, with equation  . Use this x-value as the "middle" x-value in the chart and choose 3 (or more) values less than, and greater than, this value. |
|
 Graph y = x2 + 6x - 1 (not given an interval for x). Graph y = x2 + 6x - 1 (not given an interval for x).
Rather than picking numbers at random for the x-values in the chart, find the axis of symmetry. This will guarantee that our chart will graph the turning point of the parabola, giving needed information about the function,
To find the axis of symmetry, use the formula x = -b/2a.
In this example, a = 1 and b = 6. Substituting gives: x = -(6)/2(1) = -6/2 = -3
Axis of symmetry: x = -3
Since the x-coordinate of the turning point is -3, use this value as the center value for x in the chart. Include 3 values above and below the coordinate (-3,-10)
in the chart.
Graph y = x2 + 6x - 1 (no interval specified)
x |
y |
-6 |
-1 |
-5 |
-6 |
-4 |
-9 |
-3 |
-10 |
-2 |
-9 |
-1 |
-6 |
0 |
-1 |
|
|
The graph shows the function does not cross the x-axis at integer values. The quadratic formula will be needed to find the locations where the function crosses the x-axis.
| Using the graphing calculator to graph quadratic functions. |
| You can find pertinent information regarding a parabola using a graphing utility, such as a graphing calculator. If you need help with your graphing calculator, use the link at the right. |
|
For calculator help with graphing parabolas
click here. |
|
|
| "Solving" Quadratic Equations by Graphing: |
Using a graph to determine the roots (x-intercepts) of a quadratic equation may be a difficult process. If you are graphing by hand, it may be hard to find the exact x-intercepts (the roots), especially when the x-intercepts are not integer values. If you must rely on graphing to find the roots of a quadratic equation, use a graphing utility with the capability of finding (or giving a decimal approximation for) the x-intercepts or (roots). |
|
For calculator help with quadratic equations
click here. |
|
|

NOTE: The re-posting of materials (in part or whole) from this site to the Internet
is copyright violation
and is not considered "fair use" for educators. Please read the "Terms of Use". |
|