|
Quadratic and cubic functions belong to the family of polynomial functions.
Remember: Quadratic functions are of degree 2 and have at most 2 roots.
Cubic functions are of degree 3 and have at most 3 roots.
|
A polynomial function is a function which is defined by a polynomial expression.
Examples: f(x) = x2 + x - 6; P(x) = x3 - x2 - 12x; y1 = x2 + 4x + 4 |
In Algebra 1, emphasis will be placed on the topics of "zeros (roots)", "vertex points",
and "leading coefficients"
as they relate to the graphing of quadratic and cubic functions.
("Roots" typically pertain to equations. "Zeros" typically pertain to functions. But may be interhangeable.)
Zeros (or Roots) - Quadratic:
We have seen that the fastest way to find roots (or zeros), is to factor the polynomial, and then set the factors equal to zero.
 The real numbers that create the roots (or zeros) of a polynomial correspond to the x-intercepts of the graph of the polynomial function. The real numbers that create the roots (or zeros) of a polynomial correspond to the x-intercepts of the graph of the polynomial function.
This is valuable information when it comes to creating the graph of a polynomial (without a graphing calculator). It is also valuable if you are given the graph and are attempting to create a possible equation.
Keep in mind that not all polynomial functions have roots that are real numbers. Remember those quadratic graphs that float completely above, or below, the x-axis (never crossing or touching the x-axis), because their roots are complex numbers.
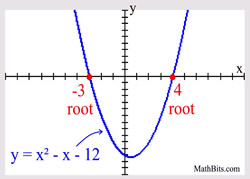
Other observations about the graph at the right:
• the fact that the leading coefficient of the quadratic is positive, tells us the graph opens upward.
• the formula for the axis of symmetry will give the turning point (vertex) coordinates.
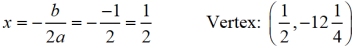
Substitute ½ into the equation to get the y-value.
|
Example:
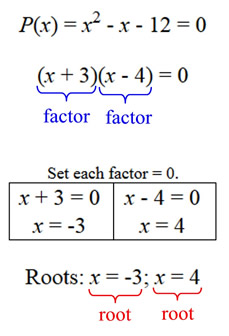
Knowing how to find the roots of a polynomial equation is essential for graphing zeros of polynomial functions.
|
Zeros (or Roots) - Cubic:
Since this graph is a cubic (degree 3), we would expect there to be three roots and three crossings of the x-axis.
And there are 3 roots and 3 x-axis crossings.
For Algebra 1, you will most likely see cubic equations given in the form shown in this problem: one linear factor times one quadratic factor (which can be easily factored further).
Remember:
The real numbers that create the roots (or zeros) of a polynomial correspond to the x-intercepts of the graph of the polynomial function.
Other observations about the graph at the right:
• when graphing by hand (without a calculator), once the roots are plotted, choose several x-values across the graph and plot those points. This will give you an ideas as to the shape of the graph,
• do not assume symmetry associated with the maximum and minimum points (turning points). There is no guarantee that the turning point will be half-way between the root values.
This maximum turning point is (-1.189, 24.193).
The x-value of -1.189 is not half-way between the roots of x = -3 and x = 2 (which would be
x = -½).
The same is true for the minimum turning point: if the minimum point were half way between 2 and 3, the x-value would be exactly 2.5. (The x-value is 2.523.) |
Example:
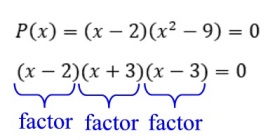
Set each factor = 0.
| x = 2 = 0 x = 2 |
| x + 3 = 0 x = -3 |
| x - 3 = 0 x = 3 |
Roots: x = 2, x = -3, x = 3
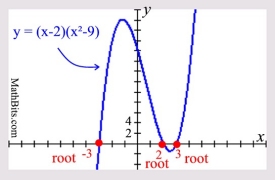
Note the increments on this graph, Tick marks on the x-axis are in increments of 1. Tick marks on the y-axis are in increments of 2.
This graph has a really tall turning point! |
What happens when a factor repeats?
Repeated Root (or Zero):
In most situations, a graph will "cross" the x-axis at each root associated with the function. There are, however, situations where the graph may simply "touch" (be tangent to) the x-axis instead.
Let's see if we can determine, before we draw the graph, whether it will "cross" the x-axis at each root, or simply "touch" (be tangent to) the x-axis at each root.
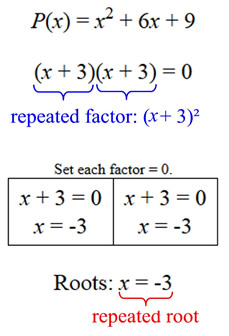
Consider the example at the right. The polynomial is of degree two, so there will be two roots (zeros). The factor of (x + 3) is repeated twice, and can also be written as (x + 3)2.
When the factor of a polynomial function repeats an EVEN number of times, the graph will only "touch" (be tangent to) the x-axis at that repeated root. |
FYI only:
The power associated with a factor is referred to as its multiplicity (the number of times it gets multiplied times itself).
"EVEN" multiplicities are factors that are multiplied an even number of times, forming squares. Since squares are always positive, the graph near the root (zero) will not change signs from positive (above the x-axis) to negative (below the x-axis), or vice versa. The graph will "touch", or "bounce off", the x-axis at the root (zero) but remain on the same side of the x-axis. |
|
Example degree 2:
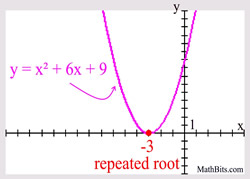
"just touching" the x-axis
may also be referred to as
"bouncing off" the x-axis.
|
What if a factor has an ODD power?
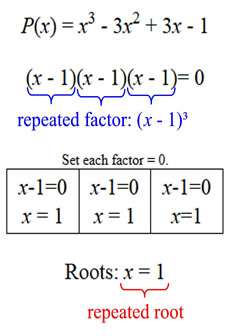
The cubic function was given in both its standard form and its factored form. You are not expected to factor this cubic in Algebra 1.
This polynomial is of degree three (a cubic), so there will be three roots (zeros).
The factor of (x - 1) appears three times,
and can be written as (x - 1)3.
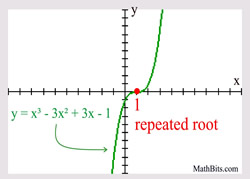
When the factor of polynomial function repeats an ODDnumber of times, the graph will "cross" the x-axis at that repeated root. |
To determine the steepness of the left and right portions of the graph, choose some test points and substitute them into the original equation. |
Example degree 3:
 |
Graphing (sketching) by Hand:
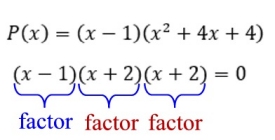
Roots: Factoring this equation further will supply the roots.
P(x) = (x - 1)(x2 + 4x + 4) = (x - 1)(x + 2)(x + 2).
The roots are 1, -2, and -2.
Since the factor (x + 2) appears twice (an EVEN number of times), the graph will only "touch" the x-axis at -2.
Since the factor of (x - 1) appears only once (and ODD number), the graph "crosses" the x-axis at 1.
Additional Information: Since we know the actual equation, we can obtain a few actual points on the graph to make our sketch more reliable. For example, picking points between the roots and picking the y-intercept are usually helpful.
The y-intercept (where x = 0) will be at (0,-4).
Test x = 0.5: (0.5,-3.125)
Test x = -1: (-1,-2)
|
Example:
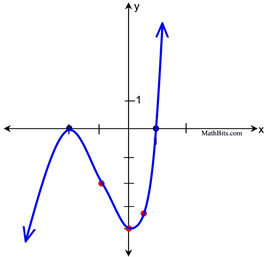
Root points in blue.
Test points in red.
|

End Behavior: Looking at a few aspects of a polynomial will tell us what is happening at either end of the graph of the polynomial function. We will be looking at the DEGREE of the polynomial and the SIGN of the leading coefficient to determine what is happening to the graph.
 |
End behavior refers to the appearance of a graph as it is followed indefinitely in either horizontal direction. |
|
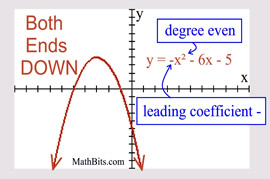
Even Degree Polynomial
("ends" behave similar to a quadratic) |
Leading coefficient POSITIVE: both "ends" are UP.
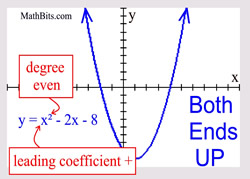
Leading coefficient NEGATIVE: both "ends" are DOWN.
|
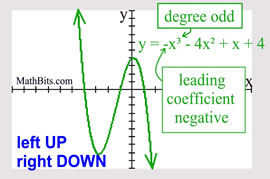
Odd Degree Polynomial
("ends" behave similar to a cubic) |
Leading coefficient POSITIVE: left end is DOWN and right end is UP.
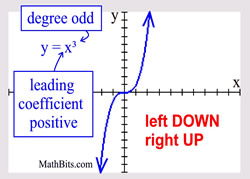
Leading coefficient NEGATIVE: left end is UP and right end is DOWN.
|
SUMMARY: The End Behavior of a Polynomial Function with Leading Term axn :
End Behavior |
n is Even (not zero) |
n is Odd |
a is positive |
Both Ends UP |
Left Down, Right Up |
a is negative |
Both Ends Down |
Left Up, Right Down |
|

NOTE: The re-posting of materials (in part or whole) from this site to the Internet
is copyright violation
and is not considered "fair use" for educators. Please read the "Terms of Use". |
|