|
 |
The slope of a straight line measures a rate of change. When you graph a straight line, you notice that the rate of change (the slope) is the same between all points along the line. The rate of change for a straight line is said to be constant (not changing). |
The rate of change of a quadratic function, however, is not constant (it does not remain the same). There are no straight line segments on a parabola.
So, can we speak of "slope" when dealing with a parabola?
The answer is "yes, in a way", but the result won't be the same as what we have seen with straight lines. When we try to speak of the slope (or rate of change) for a quadratic function (a parabola), we have to speak of the average rate of change (the slope of the segment connecting two points on the parabola). The difference will be that this average rate of change (slope) will NOT be constant. It will change based upon the location of the two points being used.
 Let's take a look at the average rate of change along a parabola. Let's take a look at the average rate of change along a parabola.
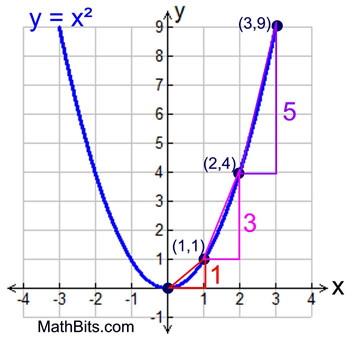
Consider the parabola y = x2.
average rate of change = slope

points being used |
average rate of change |
(0,0) and (1,1) |
1/1 = 1 |
(1,1) and (2,4) |
3/1 = 3 |
(2,4) and (3,9) |
5/1= 5 |
Do you see a pattern developing regarding the average rate of change at 1 x-unit intervals? |
|
As x increases by 1 (starting with x = 0), y increases by 1, 3, 5, 7, ...
|
 Using this Pattern and the Vertex to Graph a Parabola Using this Pattern and the Vertex to Graph a Parabola
 This method is more difficult to use if "a" is not an integer. This method is more difficult to use if "a" is not an integer.
Form: y = ax2 + bx + c or Vertex Form: y = a(x - h)2 + k
Steps for Using the Rate of Change Pattern and Vertex to Graph:
1. Before you begin, check to see if "a" is an integer.
2. The Pattern is 1, 3, 5, 7, ... as long as the value of "a" is 1.
If the value
of "a" ≠ 1 , multiply the pattern by "a". (1•a, 3•a, 5•a, 7•a)
Should "a" be negative, multiply by the negative.
3. Locate the vertex. (Most easily found from the vertex form of the quadratic.)
4. Starting at the vertex, move to the right as follows:
If "a" = 1, from the vertex:
• over 1, up 1 - plot point.
• from that point, over 1, up 3 - plot point.
• from that point, over 1, up 5 - plot point.
• from that point, over 1, up 7 - plot point. |
If "a" ≠1, from the vertex:
• over 1, up a - plot point.
• from that point, over 1, up 3a - plot point.
• from that point, over 1, up 5a - plot point.
• from that point, over 1, up 7a - plot point. |
5. Since the parabola is symmetric, plot the reflection of these points over the line of symmetry (the line through the vertex).
|
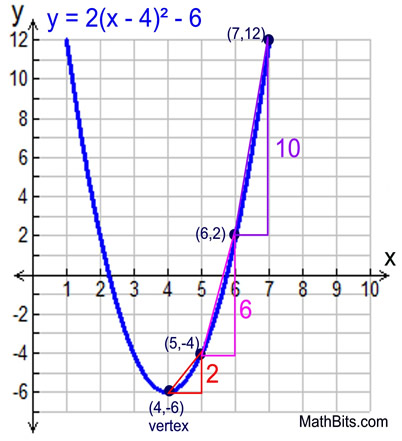
Example: y = 2(x - 4)2 - 6
Take a look at this example where the value of "a" is not 1.
Notice that the pattern becomes 2, 6, 10 (which is "a" times 1, 3, 5 since a = 2).
The left side was graphed by reflecting the points plotted on the right side of the parabola over the line of symmetry, which in this example is x = 4. The point (5,-4) becomes (3,-4) and so on.
If you can find the vertex, this method is fast and easy.
|
 |
|

NOTE: The re-posting of materials (in part or whole) from this site to the Internet
is copyright violation
and is not considered "fair use" for educators. Please read the "Terms of Use". |
|


