|
We know that the graphing calculator can find a "best fit" linear regression equation that can be used to predict new values. But, how reliable will this prediction be?
It would seem that the closer the scatter plots are to the best fit line, the more reliable the predictions from the linear regression equation.
 Is there a way to determine how well our linear regression equation fits our data? Is there a way to determine how well our linear regression equation fits our data?
Yes! There is a way of measuring the "goodness of fit" of the best fit line (linear regression), called the correlation coefficient. It is a number between -1 and 1, inclusive, which indicates the measure of linear association between the two variables, and also shows whether the correlation is positive or negative.
|
|
A correlation coefficient, designated by r, is a number in the range
-1 < r < 1, that indicates how well a linear regression equation truly
represents data being examined. |
|
• If r is close to 1 (or -1), the model is considered a "good fit".
• If r is close to 0, the model is "not a good fit".
• If r = ±1, the model is a "perfect fit" with all data points lying on the line.
A positive (+) correlation means the line has a positive slope.
A negative (-) correlation means the line has a negative slope.
• If r = 0, there is no linear relationship between the two variables.
A correlation greater than 0.8 is generally described as strong, whereas a correlation less than 0.5 is generally described as weak.
These values can vary based upon the "type" of data being examined.
A study utilizing scientific data may require a stronger correlation than a study using social science data.
|
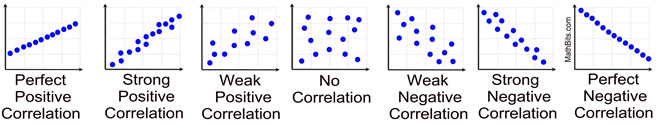
| r = 1 r > 0.8 r < 0.5 r = 0 r > -0.5 r < -0.8 r = -1 |

 Using the Graphing Calculator to find r: Using the Graphing Calculator to find r: |
Be sure the TI-84+'s "Diagnostics" are turned on.
If not, you will not see the r-value.
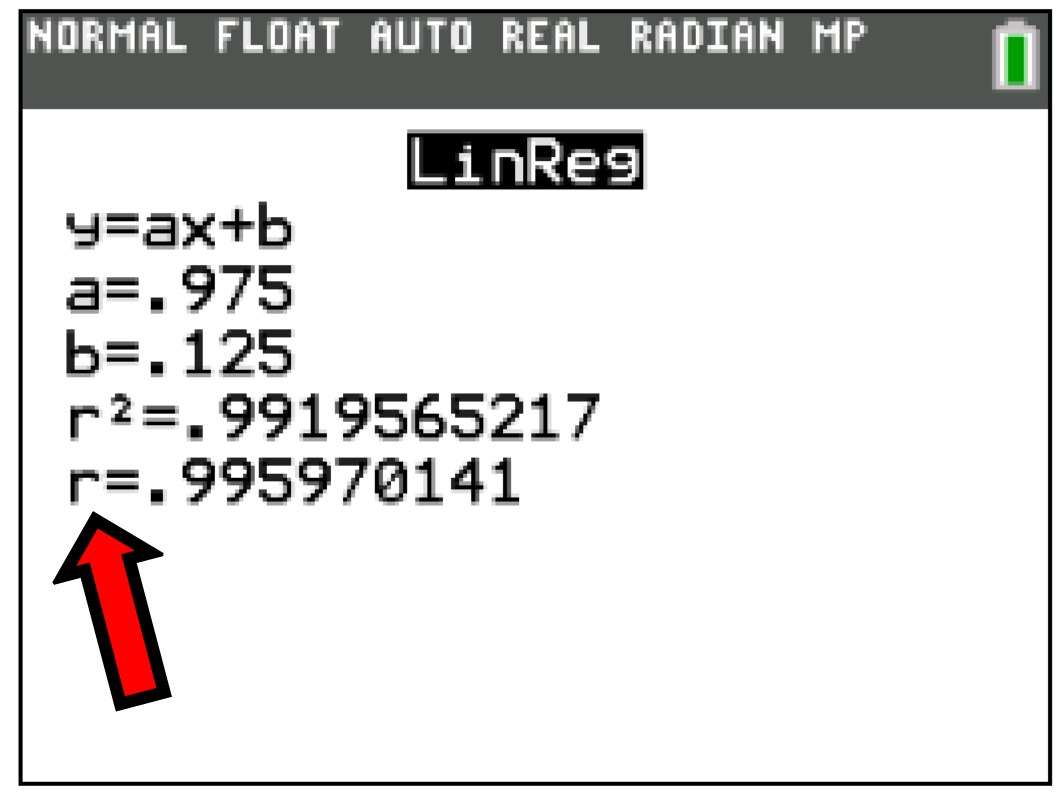
When you choose a linear regression equation on the calculator, the correlation coefficient will be displayed on the screen with the linear regression equation information (assuming the Diagnostics are turned on).
The linear regression screen shown at the right shows an "r" value of 0.995970141, which implies a strong correlation.
The linear regression equation, in this case, will be a reliable model for future forecasts or predictions.
|
|
For calculator help with
correlation coefficients
click here. |
|
|
The following discussion is for your information only.
It will not be tested in Algebra 1.
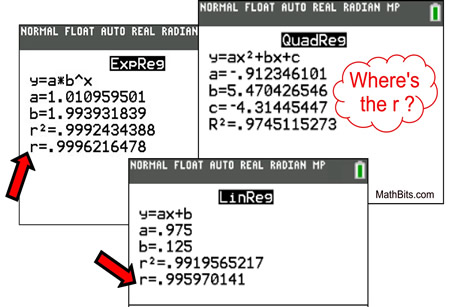 |
In the graphic on the left, the Linear Regression and the Exponential Regression each display an "r" value.
Both "r" values are nearly equal to one, implying that those regression equations are a "good fit" and will be useful predictors in relation to their data sets.
|
But what happened in the Quadratic Regression? Where is the "r"?
Remember the definition of "correlation"?
Correlation measures the strength of the linear association between two quantitative variables.
The only truly linear association exists in a linear regression.
Now, there are other regressions that can be "transformed" into linear based regression models: such as the exponential, power and logarithmic regressions. The r-value then pertains to the "transformed" data, not the non-linear data. How this is done is beyond our Algebra 1 skills. The quadratic regression, and the others you see in your graphing calcualtor's list, are not linear based regressions. |
 |
You may have noticed that all three of the regressions shown above also show an r2 value or an R2 value. These values are the coefficients of determination.
The coefficient of determination represents the percentage of the data that is the closest to the line of best fit. For example, if r = 0.992, then r2 = 0.850, which means that 85% of the total variation in y can be explained by the linear relationship between x and y (as described by the regression equation). The other 15% of the total variation in y remains unexplained.
The coefficient of determination, R2 is another measure of how well the best fit line performs as a predictor of y.
The higher the value, the more useful the model.
R2 takes on values between 0 and 1, where 1 indicates a perfect fit and a very reliable model for future forecasts. A value of 0, on the other hand, indicates that the model fails to accurately model the data set.
NOTE: The re-posting of materials (in part or whole) from this site to the Internet
is copyright violation
and is not considered "fair use" for educators. Please read the "Terms of Use". |
|