|
When an experiment is conducted, and data is collected, the probabilities obtained
from the experiment are called "experimental probabilities".
They may also be called "relative frequencies".
|
Relative frequency (or experimental probability) relates to the outcomes of an experiment. It is calculated from the number of times an event occurs in the experiment, divided by the total number of trials in that experiment. |
|
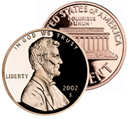
For example, the probability of getting heads on the toss
of a penny is the ratio  .
Heads is one of two possible outcomes when a penny is tossed.
This value is the theoretical probability (in "theory" the head should appear ½ or 50% of the time). |
|
| In an actual experiment, however, the number of heads that appears when the coin is tossed 100 times, might not be exactly 50 times (which would be ½ of the time). While the number of heads should be "close" to 50 times, it may be, for example, only 48 times. Then the probability of heads is 48/100 or 48% of the time. This is the experimental probability (or relative frequency). |
Relative frequency is the experimental probability.
 |
Relative frequency is used when the probability is being estimated using the outcomes from an experiment. It may be the case that the theoretical probability is not known.
When working with relative frequency, the larger the number of trials within the experiment, the more reliable the relative frequency is as an estimate of the probability.
It may be said that probability can be described as the relative frequency over an infinite number of trials. But, remember, relative frequency is not theoretical probability. It is experimental probability.

The data from a probability experiment can be recorded in a frequency table.
The word "frequency" refers to the number of times a specific result occurs,
such as the number of times a head occurs when tossing a penny.
Tossing a Penny (50 trials) |
Heads |
|
27 |
Tails |
|
23 |
|
In a frequency table, tally marks may be used to record the data as it is occurring.
You may see frequency tables with the tally marks included, or you may see only the final tally counts. |
From this experiment of tossing a penny 50 times,
we see that the experimental probability of heads is 27/50 and
the experimental probability of tails is 23/50.
These values are the relative frequency.
These results should not be surprising, because we know that
the likelihood of rolling a head (or a tail) theoretically is 1/2 or 25/50.

NOTE: The re-posting of materials (in part or whole) from this site to the Internet
is copyright violation
and is not considered "fair use" for educators. Please read the "Terms of Use". |
|


