|
Directions: Read carefully.
1. |
Which question is a statistical question?
|
 |
|
2. |
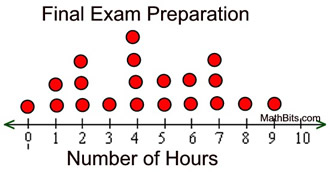
A class was surveyed to determine the number of hours that were spent preparing for the final examination. The results are shown at the right.
a) How many students were surveyed?
Choose:
|
|
| |
b) What is the mean number of hours spent studying in this survey?
Choose:
|
|
3. |
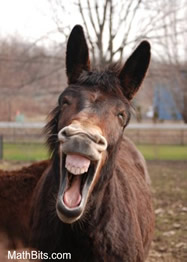
Description of a mule, named Monty:
• 14.1 hands high
• 800 pounds
• 12 years old
• purchase cost: $800
• maintenance cost: $100 a month
How would you classify this data?
Choose:
|
|
|
4. The number of snowboarding accidents reported weekly during one winter season at the Fun Mountain Resort:
12, 15, 6, 8, 12, 17, 10, 8, 7, 13, 14, 16, 8, 18, 11 |
 |
b) Find the median.
c) Find the mode.
d) A teenager wants to emphasize the safety of snowboarding. Which measure of central tendency should the teen use?
e) A parent wants to emphasize the dangers of snowboarding. Which measure of central tendency should the parent use?
|
|
5. |
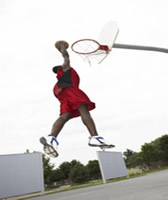
Lamar collects data to determine whether students think boys or girls are smarter. He surveys his all-male basketball team.
How would you describe this data?
Choose:
|
|
|
6. Questions pertain to the histogram shown below. |
b) How many students' heights are greater than or equal to 66 inches tall?
|
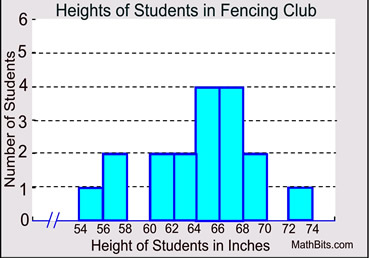 |
c) What percentage of the students have a height greater than or equal to 60 inches but less than 66 inches, to the nearest tenth of a percent?
|
d) In which interval, will you find the median student height, h?
Choose:
|
|
7. |
The following graphs show responses to different surveys.
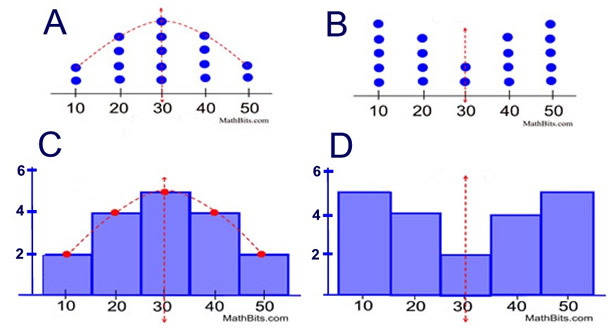
a) Which of the graphs can be described as being symmetric?
Choose:
b) Which of the graphs can be described as being a "bell curve"?
Choose:
c) Which of the graphs can allow for the value 32 to be a response from the survey?
Choose:
d) For graphs A and B, if each dot represents 3 people responding, which statement is true?
Choose:
|
|
8. |
The table displays the frequency of scores on a 10 point quiz. Find the median of the scores.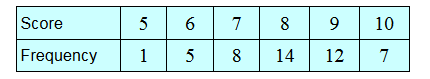
|
|
|
9. |
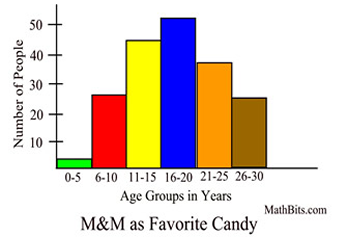
| A survey was conducted to determine how people of different ages felt about M&M candies.
Participants were asked if M&M candies were their favorite candy. |
|
Of the people surveyed, how many people 16 years of age, and older, responded positively?
|
Choose:
|
|
10. |
A survey was developed to estimate the average number of hours per week that adults spend exercising. Every third person entering a large fitness complex was surveyed, with a total of 2,500 people being surveyed. The data showed that the mean number of hours spent exercising was 3.2 hours per week. Which characteristic of the survey could create a bias in the results?
Choose:
|
|

NOTE: The re-posting of materials (in part or whole) from this site to the Internet
is copyright violation
and is not considered "fair use" for educators. Please read the "Terms of Use". |
|