Often times, we need to know more about our data than just a possible "center" value.
It can be valuable to know how the data is "distributed" (the distribution) within the data set. Working with the "median" and the "quartiles" will give us additional information regarding the extent to which the data is located near the "median" or near the extremes of the set.

 Quartiles Quartiles |
We know that a median (middle) divides a data set into two equal parts.
Now, we are going to find the middle of each of the those two equal parts.
A data set can be further subdivided into four equal parts, by values called quartiles.
Quartiles divide a data set into quarters,
with each quarter containing one-fourth (or 25%) of the data. |
The quartiles are like additional "medians" of the lower and upper halves of the data set.
The median is actually another name for the "second quartile".
Finding a quartile is similar to finding a median.
Remember, when finding medians, the approach differs depending upon an even number of data versus an odd number of data.
Quartiles are also affected by an even versus odd number of data values.
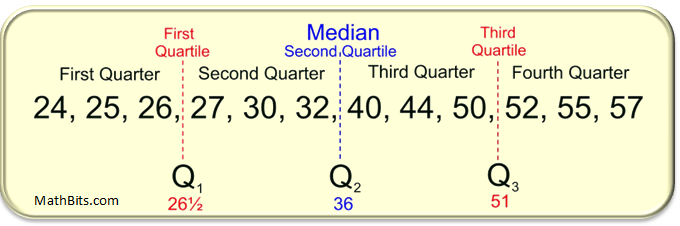
Finding Quartiles - Even Number of Data Values
(data values are in ascending, or descending, order)
Steps:
• Find the median (second quartile) as the average of the two middle data values.
• You will now have an even number of data values in both halves of the data set.
• Find the median of the lower half (first quartile).
• Find the median of the upper half (third quartile).
Q1: The first quartile is the middle (the median) of the lower half of the data set. One-fourth (25%) of the data lies below the first quartile, and three-fourths (75%) lies above. |
Q2: The second quartile is another name for the median of the entire set. One-half (50%) of the data lies below the second quartile, and one-half (50%) lies above. |
Q3: The third quartile is the middle (the median) of the upper half of the data set. Three-fourths (75%) of the data lies below the third quartile and one-fourth (25%) lies above. |
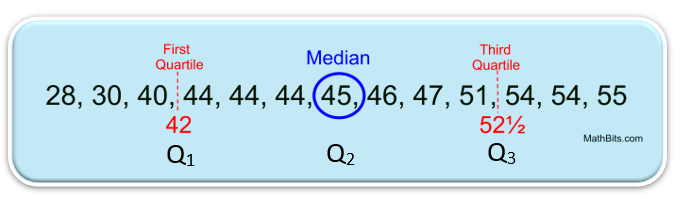
Finding Quartiles - Odd Number of Data Values
(data values are in ascending, or descending, order)
Steps:
• Find the median (second quartile) as the middle data value.
• You will now have an even number of data values on either side of the median
(not counting the median value).
• Find the median of that even numbered lower half (first quartile).
• Find the median of that even numbered upper half (third quartile).
Note: A quartile is a number, it is not a range of values.
Data can be described as being "above" or "below" the first quartile, but data is never "in" the first quartile.
You can speak of a "quartile range", but the term "quartile" means the Q1 value only.
Note: The first quartile may be referred to as the "lower quartile".
The third quartile may be referred to as the "upper quartile".
Interquartile Range (IQR) |
We are familiar with the term "range" being a measure of spread (or variation) of the data set.
The "range" is the difference between the
maximum value and the minimum value in the set.
Using quartiles, we now can establish another measure of spread (or variation).
The difference between the third quartile and first quartile is called
the interquartile range (IQR).
The interquartile range is the distance between the first and third quartiles
and is considered a more stable statistic than the "range" of the set.
The IQR contains 50% of the data.
|
For the first data set shown above on this page,
the IQR = 51 - 26½ = 24½. |
Quartiles and Outliers |
It may be the case that a data value falls well outside the range of the other values in the set.
Such data values are called outliers (as they "lie outside" the other values) .
We will see in future lessons that outliers may lead to false impressions
regarding the distribution of a data set.
Outliers can be defined as those data points that fall more than a specified distance from the first or third quartiles.
That specified distance to establish an outlier is 1.5 • IQR (one and one-half times the IQR). |
Outliers are:
greater than Q3 + (1.5 • IQR)
(referred to as the upper fence)
or less than Q1 - (1.5 • IQR)
(referred to as the lower fence) |
|
| Data points that fall to the far left, or far right, of an ordered data set can be tested as possible outliers using this formula. |