|
Let's see how to pull together the degree, roots, multiplicities, and end behavior
of a polynomial function to create its sketch or analyze an existing sketch.
Depending upon the information given, it may be possible to only produce a "rough sketch" of the graph instead of an actual graph such as you would see on your graphing calculator. In some cases, there will be insufficient information to determine the y-values of coordinates. In such situations, the "sketch" will be produced using only the x-axis as a reference line.
Note: the process we will be using to create sketches, assumes that all of the zeros are real numbers.
If there are complex zeros, this process may miss this information and may not yield a reliable sketch.
Further analysis will be needed to deal with complex roots.
 (No Graphing Calculator!) (No Graphing Calculator!) |
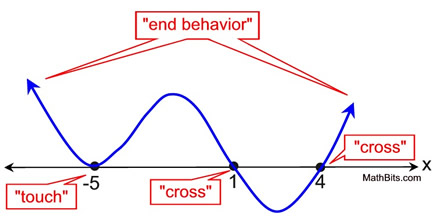
Given a positive leading coefficient, with root x = -5 with multiplicity of 2, root x = 1 with multiplicity of 1 and root x = 4 with multiplicity of 1, produce a sketch of this polynomial function. Assume all roots are given.
|
Note: This will be a rough sketch since without knowing "a", the leading coefficient, we will be unable to obtain a "definite" equation for this situation.
Analysis:
Degree: Since this polynomial function has 4 roots (one repeated), we will be dealing with degree 4.
End
Behavior: Even degree with positive leading coefficient tells us that BOTH ends point up.
Multiplicity: Root x = - 5 with multiplicity 2 will just "touch" (or "bounce off") the x-axis. Roots x = 1 and x = 4, each with multiplicity of 1, will "cross" the x-axis.
Preparing Graph:
Plot the roots first. Using your end-behavior information, start the graph from the left and intersect with each root until the last root is completed, and the right side end-behavior is drawn.
Sketch:
 |
Comments:
We know that this graph will have a relative minimum at (-5,0), We do not know exactly where the relative maximum between x = -5 and x = 1 will occur, or how high it will reach on the y-axis. Similarly, we do not know the exact location of the relative minimum between 1 and 4.
We do, however, get a feel for what the graph is doing.
|
What if:
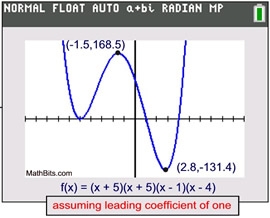
If we assume that the leading coefficient is ONE, we could produce the graph shown at the right by graphing
f(x) = (x + 5)(x + 5)(x - 1)(x - 4). Notice the different scales on the x and y axes. The x-axis is using a scale of 1, but the relative maximum at x = -1.5 is showing a y value of 168.5 and the relative minimum at x = 2.8 is showing a y value of -131.4. Remember, this is only ONE possible graph. A common factor other than ONE will vertically stretch or compress the locations of the relative maximum at x = -1.5 and the relative minimum at x = 2.8.
|
 |
|

 (No Graphing Calculator!) (No Graphing Calculator!) |
Given the polynomial function sketch shown below, describe what you know about the equation of this polynomial based upon the degree, the roots, and the end behaviors. Assume all roots are reals. |
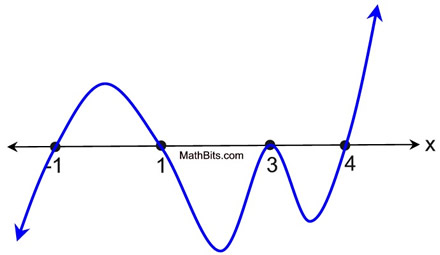 |
One Possible Analysis:
Roots: Real roots appear at x = -1,
x = 1, x = 3 and x = 4.
Multiplicity: Since the graph "crosses" the x-axis at -1, 1 and 4, these roots have a multiplicity that is odd (let's say 1). The graph only "touches" the x-axis at 3, so the multiplicity is even (let's say 2).
Degree: Since the degree is the sum of the multiplicities, for our choices the degree is 5.
End
Behavior: The degree is odd and the pattern is LEFT DOWN and RIGHT UP. The leading coefficient of this equation will be positive.
|
Equation Information:
We know this could be a 5th degree equation of the form P(x) = (x + 1)(x - 1)(x - 3)(x - 3)(x - 4).
We know that the leading coefficient is positive (as indicated by the end behavior), but we don't know its actual value.
This theoretically could also be the rough sketch of a graph where the multiplicities are larger odd and even values, making the degree larger, such as
P(x) = (x + 1)3(x - 1)5(x - 3)4(x - 4)3. |
|
Sketch the graph of P(x) = x3 + 3x2 - 4. (No Graphing Calculator!) |
This problem differs from the previous examples in that it has supplied the actual equation of the polynomial function.
Since we know the equation, we will be able to make a more reliable sketch.
Analysis:
Roots: Factoring this equation will supply the roots.
P(x) = x3 + 3x2 - 4 = (x + 2)(x + 2)(x - 1).
Since the constant term is -4, the possible factors are ±1, ±2 or ±4. Use the Polynomial Remainder Theorem to determine the factors.
The roots are -2, -2, and 1.
Multiplicity: Since the factor (x + 2) appears twice, its multiplicity is 2 telling us the graph will only "touch" the x-axis at -2. Since the multiplicity of (x - 1) is 1, the graph "crosses" the x-axis at 1.
End
Behavior: The degree is odd and the leading coefficient is positive, so the end behavior pattern is LEFT DOWN and RIGHT UP.
Additional Information: Since we know the actual equation, we can obtain a few actual points on the graph to make our sketch more reliable. For example, picking points between the roots and picking the y-intercept are usually helpful.
The y-intercept (where x = 0) will be at (0,-4).
Test x = 0.5: (0.5,-3.125)
Test x = -1: (-1,-2) |
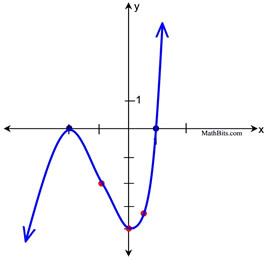
Root points in blue.
Test points in red.
If you also plot points to the right of
x = 1 and to the left of x = -2, you
will be able to see how fast the graph
is increasing (to show how steep
to make the end behaviors).
|
|

NOTE: The re-posting of materials (in part or whole) from this site to the Internet
is copyright violation
and is not considered "fair use" for educators. Please read the "Terms of Use". |
|