|
The graphs of quadratic functions, f (x) = ax2 + bx + c,
are called parabolas. |
 Shape of the Graph: |
|
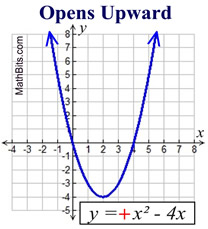
Parabolas have a shape that resembles (but is not the same as) the letter U.
Parabolas may open upward or downward.
If the sign of the leading coefficient, a, is positive (a > 0), the parabola opens upward. |
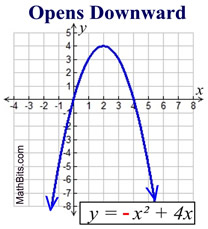
If the sign of the leading coefficient, a, is negative (a < 0), the parabola opens downward.
If a = 0, there is no x2 term, and you have a linear, not a quadratic, function.
Notice that the shape of a parabola passes the Vertical Line Test to establish that it is a function. It fails, however, the Horizontal Line Test to establish that its inverse will be a function. Since a horizontal line intersects the graph in more than once, the inverse of a parabola is not a function.

Parts of the Graph: |
|
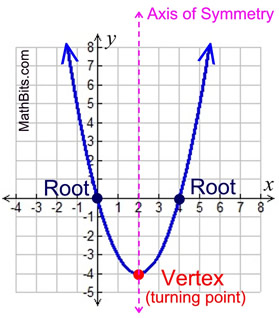
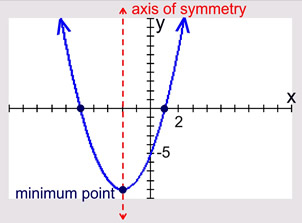
The bottom (or top) of the U is called the vertex, or the turning point. The vertex of a parabola opening upward is also called the minimum point. The vertex of a parabola opening downward is also called the maximum point.
The x-intercepts are called the zeros, or roots. To find the x-intercepts, set ax2 + bx + c = 0.
The ends of the graph (end behavior) continue to positive infinity when the graph opens upward (a > 0), or to negative infinity when the graph opens downward (a < 0).
(The only exception is when limitations are placed on the domain of the function, such as "graph only the interval
[-3,7]".) |
Axis of Symmetry:
The parabola is symmetric (a mirror image) about a vertical line drawn through its vertex (turning point). This line is called the axis of symmetry. The equation for the axis of symmetry is  . .
Parabola: y = x2 + 4x - 5
|
Parabola: y = -x2 + x + 6
Axis of symmetry:
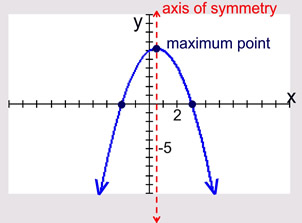
Increasing from - ∞ to ½.
Decreasing from ½ to ∞.
|
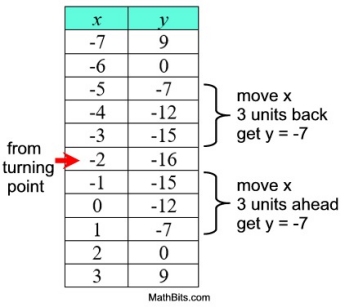
Table of Values:
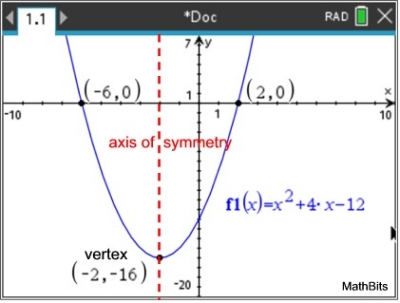
Consider the parabola f (x) = x2 + 4x - 12.
Let's take a look at the table of values for this graph.
• The table can show where the zeros (roots, x-intercepts) are located (look for y = 0, such as at at x = 2 and x = -6).
• The table can show the y-intercept, located at x = 0, having a y-value of -12 for this graph.
Remember that the y-intercept is also the c-value from the equation. f (x) = x2 + 4x - 12.
• The table also can show the symmetry of the graph. Moving a designated distance "back" and "ahead", on the x-axis, from the turning point at x = -2, will yield the same y-values at each of those points.
The graph is a mirror image over the axis of symmetry.
This concept used in reverse, can show the turning point (or vertex) of a parabola, by finding the point around which the symmetry is occurring. Example: Using points (-5,-7) and (1,-7), with a horizontal distance of 6 units, places the vertex at x = -2, halfway between the points.)
FYI: Interesting note about the tables for quadratic graphs:
f (x) = x2 + 4x - 12
(same graph and table discussed above)
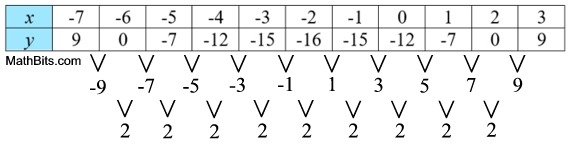
Compute the difference of two consecutive y-values in this table,
taking the right value minus the left value.
A pattern of values emerges: -9, -7, -5, -3, -1, 1, 3, 5, 7, 9
Repeat the process again using the new pattern values.
The result is 2, 2, 2, 2, 2, 2, 2, 2, 2.
Do all quadratic functions yield a constant (the value 2)?
Well, the answer is "yes" and "no".
What they all will yield is a constant that is "2a"
where "a" is the leading coefficient of the quadratic. |
Why is this true???
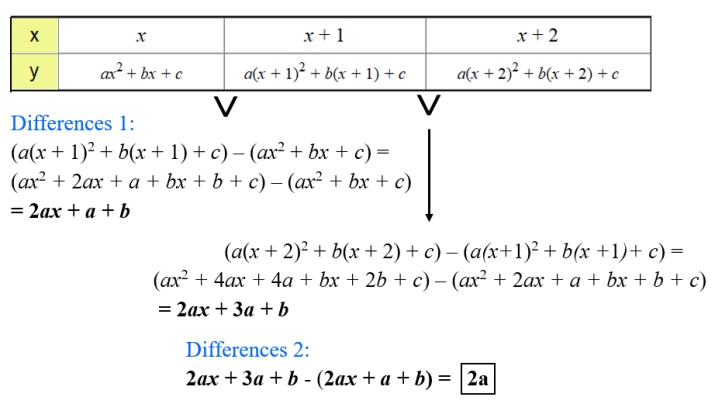
The answer to this question requires a generalized algebraic solution.
We will assume the difference between the x-values in the table will be "1", as it was in our example. So, we will express three consecutive x-values as x, x + 1, and x + 2.
Remember: we will use the equation y = ax2 + bx + c to find our accompanying y-values.
• For x, the y-value = ax2 + bx + c.
• For x + 1, the y-value = a(x + 1)2 + b(x + 1 + c
• For x + 2, the y-value = a(x + 2)2 + b(x + 2) + c
|
For
calculator help
with
graphing
parabolas
click here. |
|
|
|
For calculator help with graphing parabolas
click here. |
|
|

NOTE: The re-posting of materials (in part or whole) from this site to the Internet
is copyright violation
and is not considered "fair use" for educators. Please read the "Terms of Use". |
|